Compare Consensus and Reference Graphs or STRINGdb Networks
Source:R/compare_consensus.R
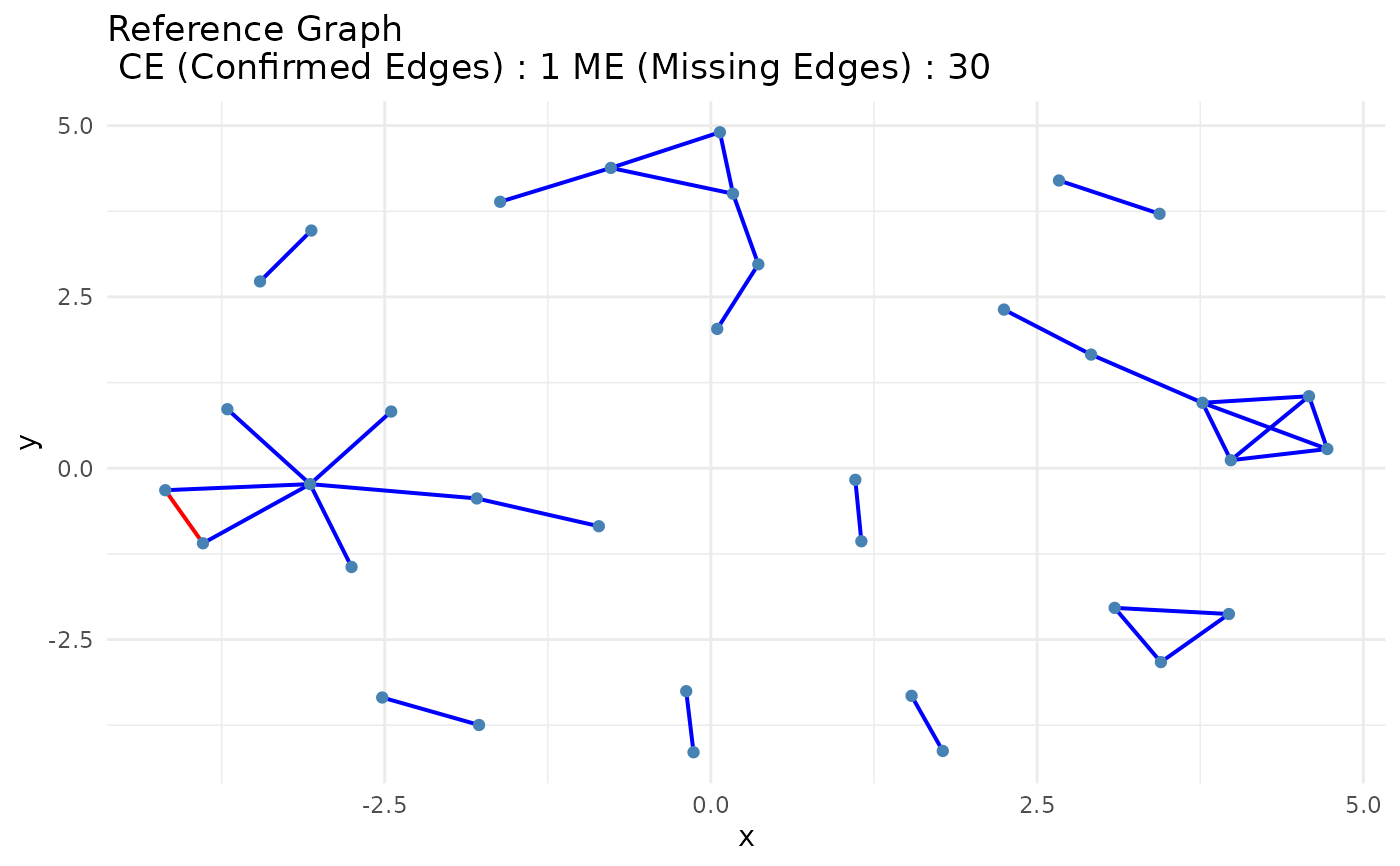
compare_consensus.RdConvenience wrapper that classifies edges and visualizes the comparison
between consensus and reference networks. For more control, use the
individual functions: classify_edges and
plot_network_comparison.
Arguments
- consensus_matrix
A SummarizedExperiment object representing the consensus network.
- reference_matrix
Optional. A SummarizedExperiment obj representing the reference network. If
NULL, STRINGdb is queried.- false_plot
Logical. If
TRUE, displays False Positives plot. Default isFALSE.
Details
If no reference_matrix is provided, STRINGdb is queried
to generate a high-confidence physical interaction network.
Note
Requires ggraph and ggplot2. If reference_matrix
is NULL, also requires STRINGdb. If false_plot = TRUE,
requires patchwork.
Examples
data(toy_counts)
data(toy_adj_matrix)


# Infer networks (toy_counts is already a MultiAssayExperiment)
networks <- infer_networks(
    count_matrices_list = toy_counts,
    method = "GENIE3",
    nCores = 1
)
head(networks[[1]])
#>   regulatoryGene targetGene    weight
#> 1          HLA-B        FTL 0.2017462
#> 2            FTL       FTH1 0.1556962
#> 3           CD74      CXCR4 0.1551853
#> 4          HLA-B      HLA-A 0.1536305
#> 5          HLA-A      HLA-B 0.1497179
#> 6           FTH1        FTL 0.1475864

# Generate adjacency matrices
wadj_se <- generate_adjacency(networks)
swadj_se <- symmetrize(wadj_se, weight_function = "mean")

# Apply cutoff
binary_se <- cutoff_adjacency(
    count_matrices = toy_counts,
    weighted_adjm_list = swadj_se,
    n = 1,
    method = "GENIE3",
    quantile_threshold = 0.95,
    nCores = 1,
    debug = TRUE
)
#> [Method: GENIE3] Matrix 1 → Cutoff = 0.06129
#> [Method: GENIE3] Matrix 2 → Cutoff = 0.06636
#> [Method: GENIE3] Matrix 3 → Cutoff = 0.06793
head(binary_se[[1]])
#> [1] "ACTG1" "ARPC2" "ARPC3" "BTF3"  "CD3D"  "CD3E"

consensus <- create_consensus(binary_se, method = "union")

# Wrap reference matrix in SummarizedExperiment
ref_se <- build_network_se(list(reference = toy_adj_matrix))

# Compare consensus to reference
compare_consensus(
    consensus,
    reference_matrix = ref_se,
    false_plot = FALSE
)