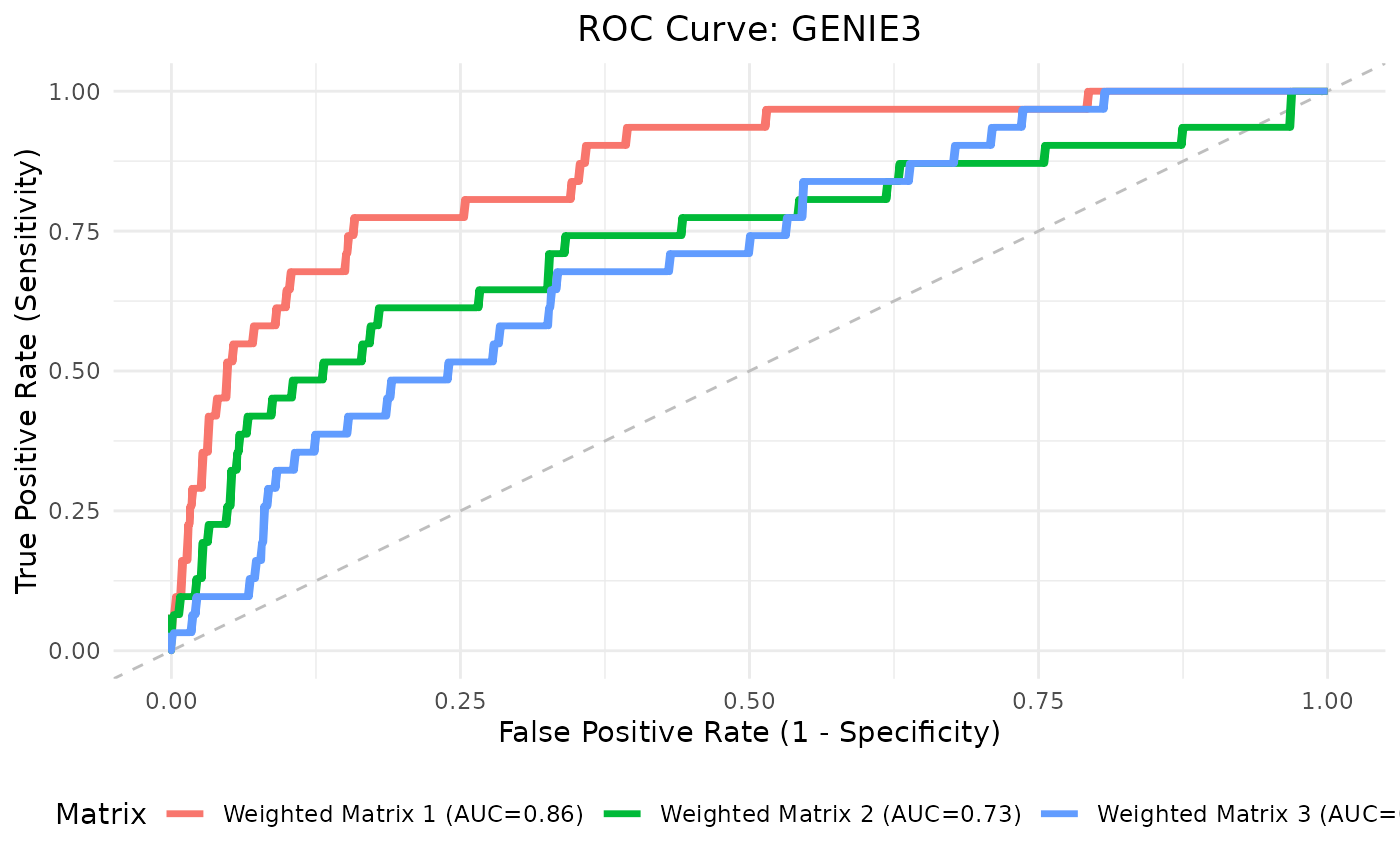
Computes and visualizes Receiver Operating Characteristic (ROC) curves for predicted adjacency matrices stored in a SummarizedExperiment object, compared against a binary ground truth network.
Arguments
- predicted_se
A SummarizedExperiment object containing predicted adjacency matrices as assays. Each matrix must share dimnames with
ground_truth;entries may be binary (0/1) or continuous weights.- ground_truth
A square binary matrix indicating true interactions (1) in the upper triangle. Must match dims and names of each assay in
predicted_se.- plot_title
Character string. Title for the ROC plot.
- is_binary
Logical. If
TRUE, treat matrices as binary predictions. DefaultFALSEfor weighted predictions.
Details
For binary matrices, a single TPR/FPR point is computed per matrix. For weighted ones, a full ROC curve is computed from continuous scores. Diagonals are ignored; symmetry is not enforced.
Examples
data(toy_counts)
data(toy_adj_matrix)


# Infer networks (toy_counts is already a MultiAssayExperiment)
networks <- infer_networks(
    count_matrices_list = toy_counts,
    method = "GENIE3",
    nCores = 1
)
head(networks[[1]])
#>   regulatoryGene targetGene    weight
#> 1          HLA-B        FTL 0.1883866
#> 2           CD74      CXCR4 0.1576324
#> 3          HLA-A      HLA-B 0.1575450
#> 4           FTH1        FTL 0.1439736
#> 5            FTL       FTH1 0.1422412
#> 6          HLA-B      HLA-A 0.1386582

# Generate and symmetrize adjacency matrices (returns SummarizedExperiment)
wadj_se <- generate_adjacency(networks)
swadj_se <- symmetrize(wadj_se, weight_function = "mean")

# plotROC now accepts SummarizedExperiment directly
roc_res <- plotROC(
    swadj_se,
    toy_adj_matrix,
    plot_title = "ROC Curve: GENIE3",
    is_binary = FALSE
)
#> Registered S3 methods overwritten by 'pROC':
#>   method    from
#>   print.roc fmsb
#>   plot.roc  fmsb
roc_res$plot

auc_joint <- roc_res$auc