Computes classification metrics by comparing predicted adjacency matrices to a ground truth binary network and visualizes the performance via a radar (spider) plot.
Arguments
- ground_truth
A square binary adjacency matrix representing the ground truth network. Values must be 0 or 1. Only the upper triangle is used for evaluation.
- predicted_list
A list of predicted adjacency matrices to evaluate, or a SummarizedExperiment object containing such matrices as assays. Each matrix must have the same dimensions and row/column names as
ground_truth.- zero_diag
Logical. If
TRUE(default), sets the diagonal ofground_truthto zero before evaluation, removing self-loops.
Value
A list with one element:Statistics: Data frame of evaluation metrics (TP, TN, FP, FN,
TPR, FPR, Precision, F1, MCC) for each predicted matrix.
Details
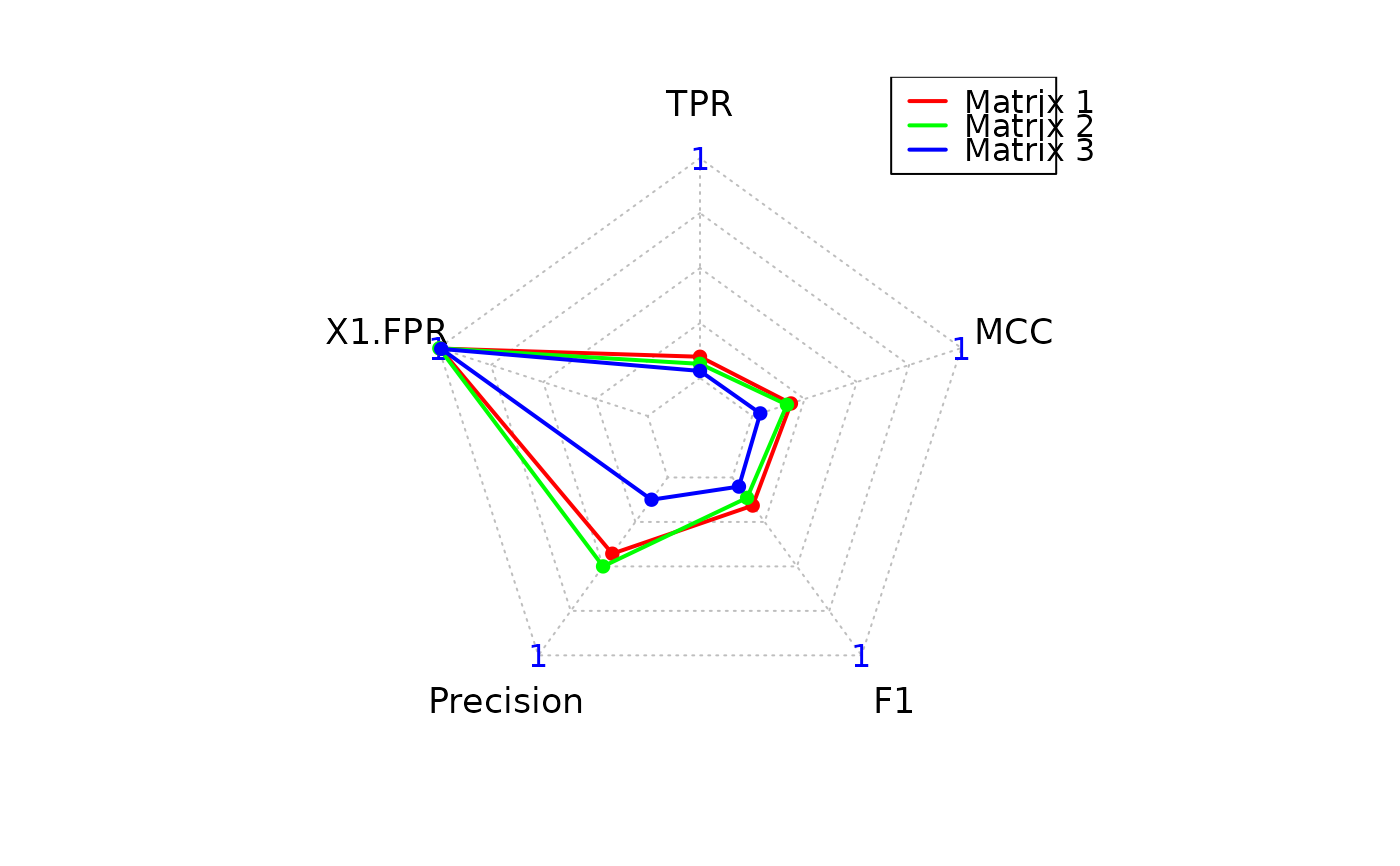
For each predicted matrix, the confusion matrix is computed using the upper triangle (non-self edges). Metrics including True Positive Rate (TPR), False Positive Rate (FPR), Precision, F1-score, and Matthews Correlation Coefficient (MCC) are calculated.
A radar plot is automatically generated summarizing the key scores across matrices.
Examples
data(toy_counts)
data(toy_adj_matrix)


# Infer networks (toy_counts is already a MultiAssayExperiment)
networks <- infer_networks(
    count_matrices_list = toy_counts,
    method = "GENIE3",
    nCores = 1
)

# Generate adjacency matrices
wadj_se <- generate_adjacency(networks)
swadj_se <- symmetrize(wadj_se, weight_function = "mean")

# Apply cutoff
binary_se <- cutoff_adjacency(
    count_matrices = toy_counts,
    weighted_adjm_list = swadj_se,
    n = 1,
    method = "GENIE3",
    quantile_threshold = 0.95,
    nCores = 1,
    debug = TRUE
)
#> [Method: GENIE3] Matrix 1 → Cutoff = 0.06168
#> [Method: GENIE3] Matrix 2 → Cutoff = 0.06622
#> [Method: GENIE3] Matrix 3 → Cutoff = 0.06351

pscores_data <- pscores(toy_adj_matrix, binary_se)