Visualize Community and Topology Comparison
Source:R/plot_community_comparison.R
plot_community_comparison.RdCreates visualization plots for community assignment metrics and topological properties comparison.
Arguments
- community_metrics
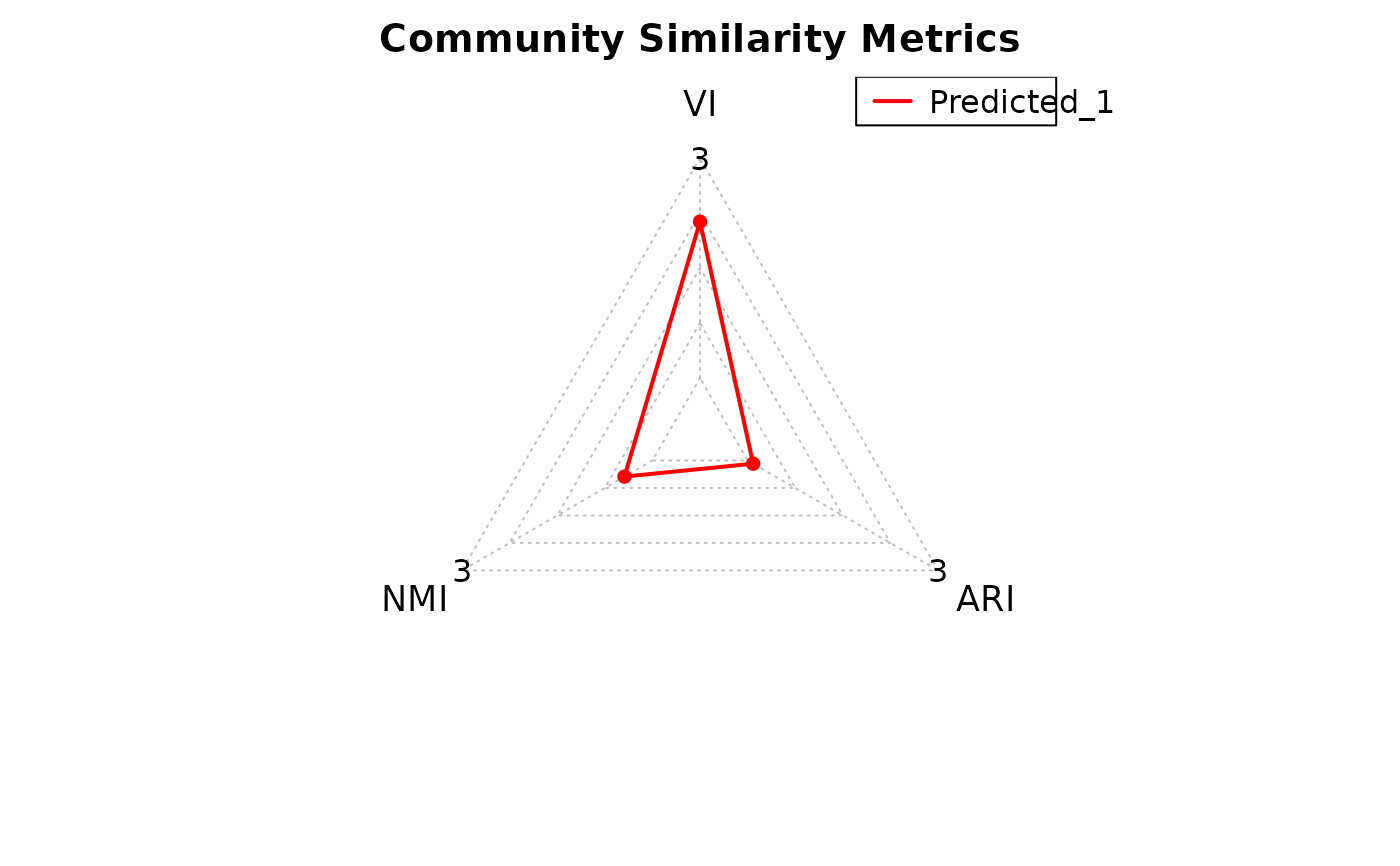
A data frame with VI, NMI, and ARI scores (output from
compute_community_metrics()).- topology_measures
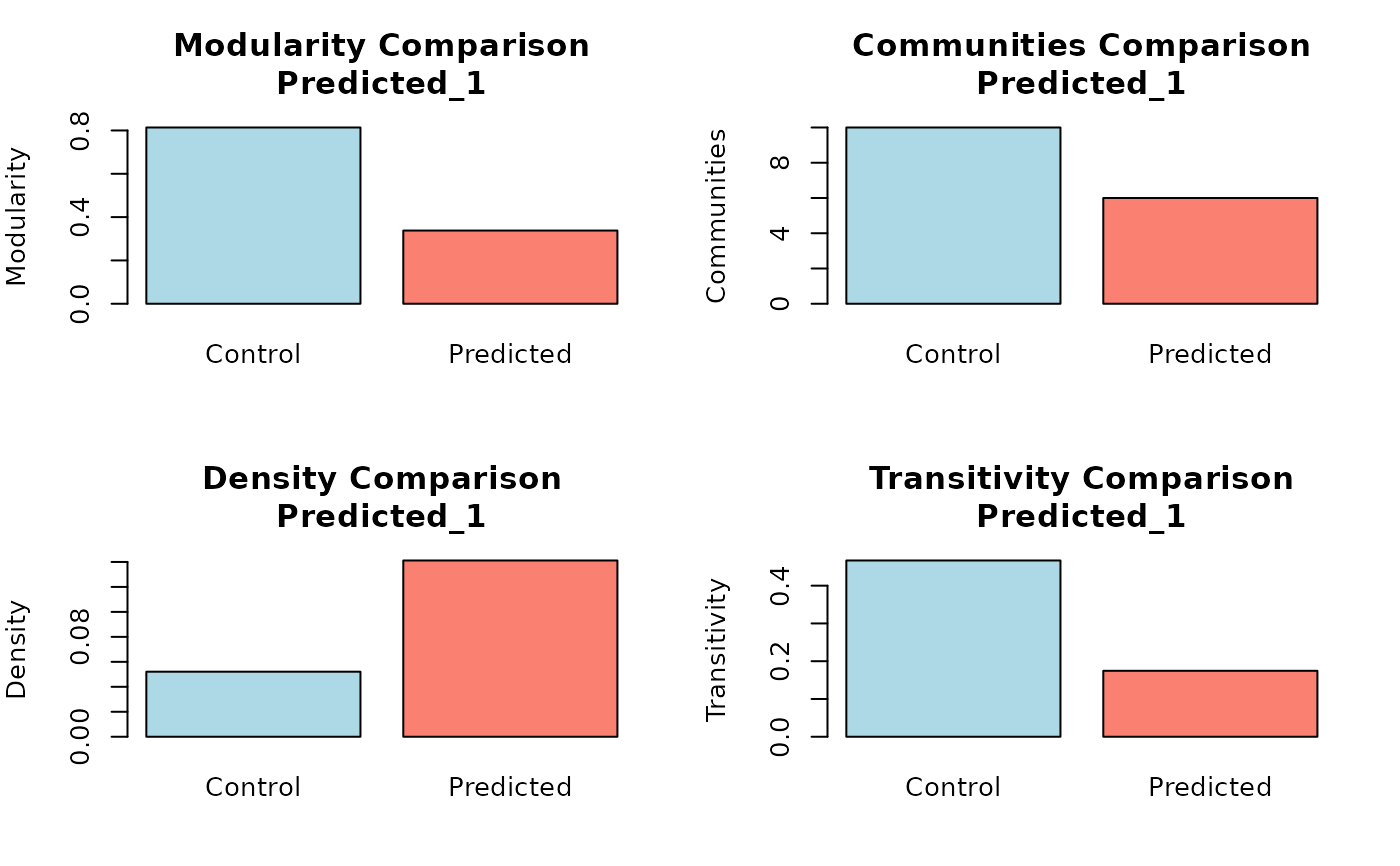
A data frame with Modularity, Communities, Density, and Transitivity (from
compute_topology_metrics()).- control_topology
A named numeric vector of control network topology metrics (from
compute_topology_metrics()).
Value
Invisibly returns NULL. Displays a radar plot for community metrics and bar plots for topology comparison.
Details
This function requires the fmsb package for radar chart visualization. The radar plot shows normalized community similarity metrics. The bar plots compare raw topological properties between predicted and control networks.
Examples
data(toy_counts)
data(toy_adj_matrix)
# Infer networks (toy_counts is already a MultiAssayExperiment)
networks <- infer_networks(
count_matrices_list = toy_counts,
method = "GENIE3",
nCores = 1
)
# Generate adjacency matrices
wadj_se <- generate_adjacency(networks)
swadj_se <- symmetrize(wadj_se, weight_function = "mean")
# Apply cutoff
binary_se <- cutoff_adjacency(
count_matrices = toy_counts,
weighted_adjm_list = swadj_se,
n = 1,
method = "GENIE3",
quantile_threshold = 0.95,
nCores = 1
)
consensus <- create_consensus(binary_se, method = "union")
comm_cons <- community_path(consensus)
#> Detecting communities...
 #> Running pathway enrichment...
#> 'select()' returned 1:1 mapping between keys and columns
#> 'select()' returned 1:1 mapping between keys and columns
#> 'select()' returned 1:1 mapping between keys and columns
#> 'select()' returned 1:1 mapping between keys and columns
#> 'select()' returned 1:1 mapping between keys and columns
comm_truth <- community_path(toy_adj_matrix)
#> Detecting communities...
#> Running pathway enrichment...
#> 'select()' returned 1:1 mapping between keys and columns
#> 'select()' returned 1:1 mapping between keys and columns
#> 'select()' returned 1:1 mapping between keys and columns
#> 'select()' returned 1:1 mapping between keys and columns
#> 'select()' returned 1:1 mapping between keys and columns
comm_truth <- community_path(toy_adj_matrix)
#> Detecting communities...
 #> Running pathway enrichment...
#> 'select()' returned 1:1 mapping between keys and columns
#> 'select()' returned 1:1 mapping between keys and columns
#> 'select()' returned 1:1 mapping between keys and columns
comm_metrics <- compute_community_metrics(comm_truth, list(comm_cons))
topo_metrics <- compute_topology_metrics(comm_truth, list(comm_cons))
plot_community_comparison(
comm_metrics,
topo_metrics$topology_measures,
topo_metrics$control_topology
)
#> Running pathway enrichment...
#> 'select()' returned 1:1 mapping between keys and columns
#> 'select()' returned 1:1 mapping between keys and columns
#> 'select()' returned 1:1 mapping between keys and columns
comm_metrics <- compute_community_metrics(comm_truth, list(comm_cons))
topo_metrics <- compute_topology_metrics(comm_truth, list(comm_cons))
plot_community_comparison(
comm_metrics,
topo_metrics$topology_measures,
topo_metrics$control_topology
)